Why use Embedded Analytics
Embedded Analytics is built directly into Door Tablet, giving you instant visibility into how your spaces are used - all without external tools or configuration.
Here’s what makes it valuable:
- Instant insights - As soon as your system is running, analytics data starts collecting automatically.
- Zero setup - No configuration or account linking required; it’s ready out of the box.
- Simple to explore - Just select the areas you want to review and click Chart to generate reports.
- Works anywhere - Designed for both cloud and on-premises environments, even without internet access.
- Secure and private - All data stays within your Door Tablet system, under your full control.
Accessing Embedded Analytics
Access analytics through the Door Tablet Web UI. Navigate to Bookings, then Embedded Analytics, Click Chart to view and generate reports. Each page provides a unique perspective on your workspace usage.
For a step-by-step guide, see our Embedded Analytics help page
Analytics types
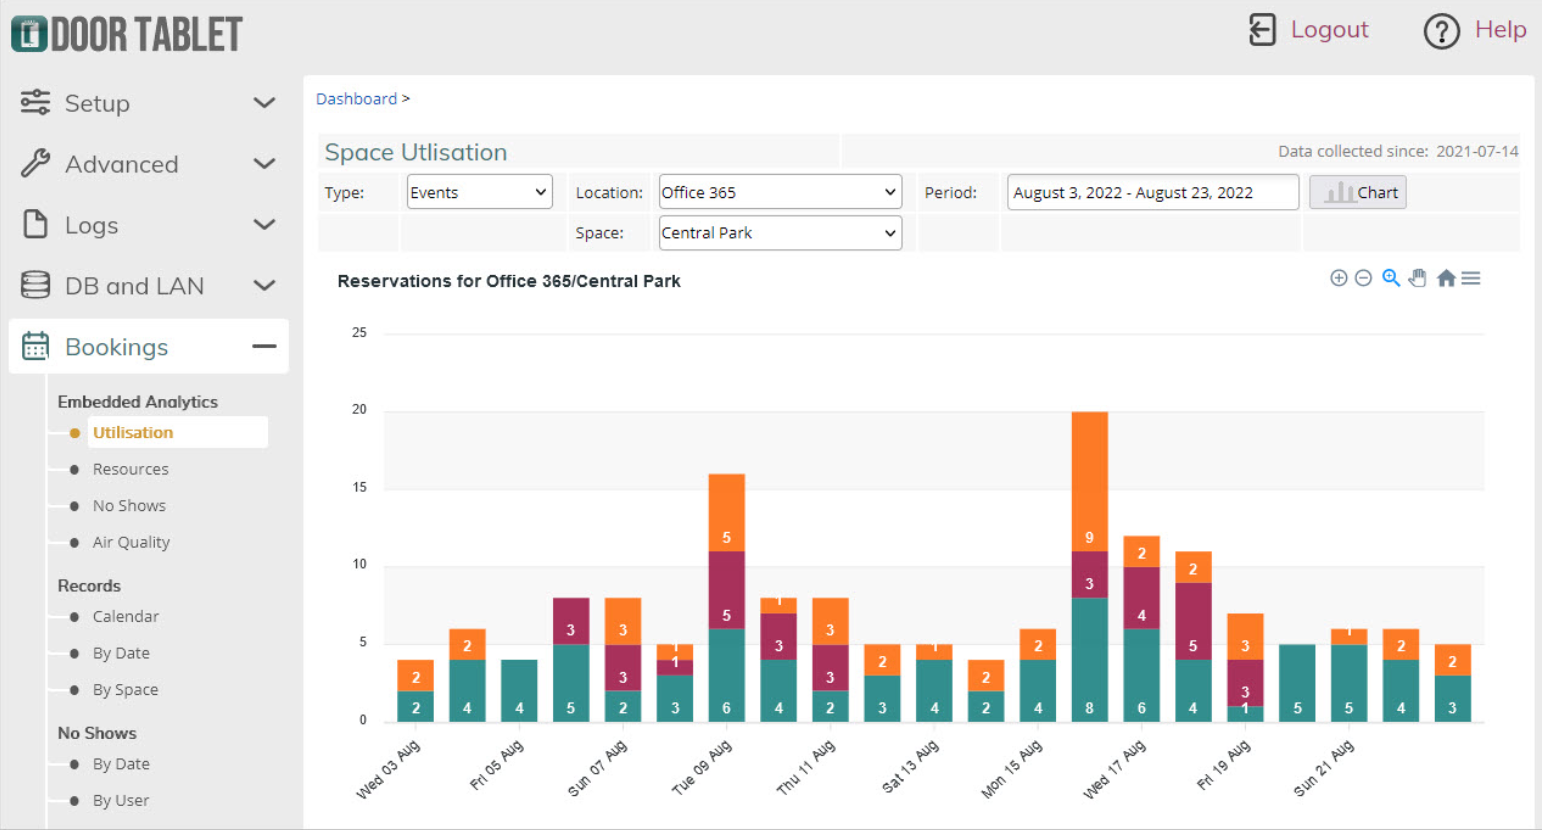
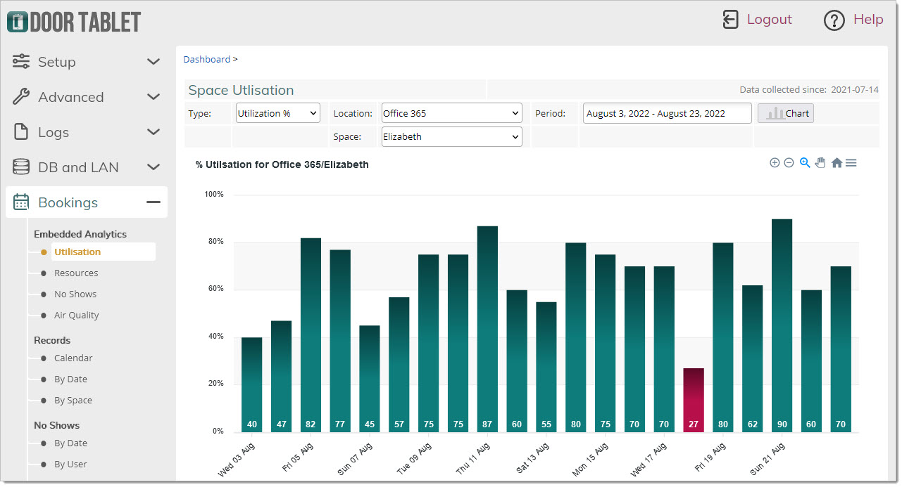
- Utilisation - Shows how often each workspace or meeting room is booked and used, helping identify under- or over-utilised spaces.
- Resource Comparison - Displays performance and occupancy across resources within the same area for a selected period. You can review both the total hours used and the percentage usage of each resource
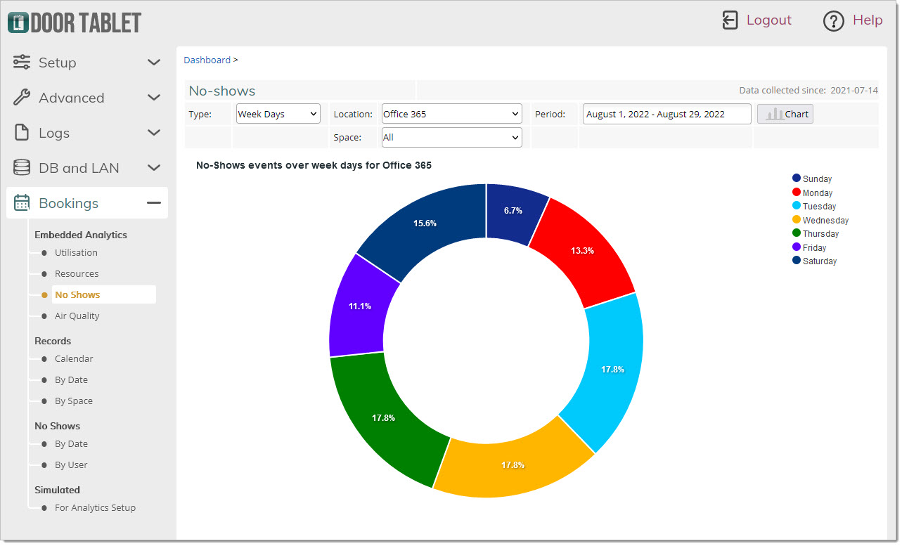
- No Shows - Summarises no-show events for statistical analysis. For details of specific hosts who failed to check in, use the dedicated No-Show Reports section under Bookings
- Air Quality - If Air Quality and/or CO₂ sensors are configured, this section displays environmental readings correlated with room usage.
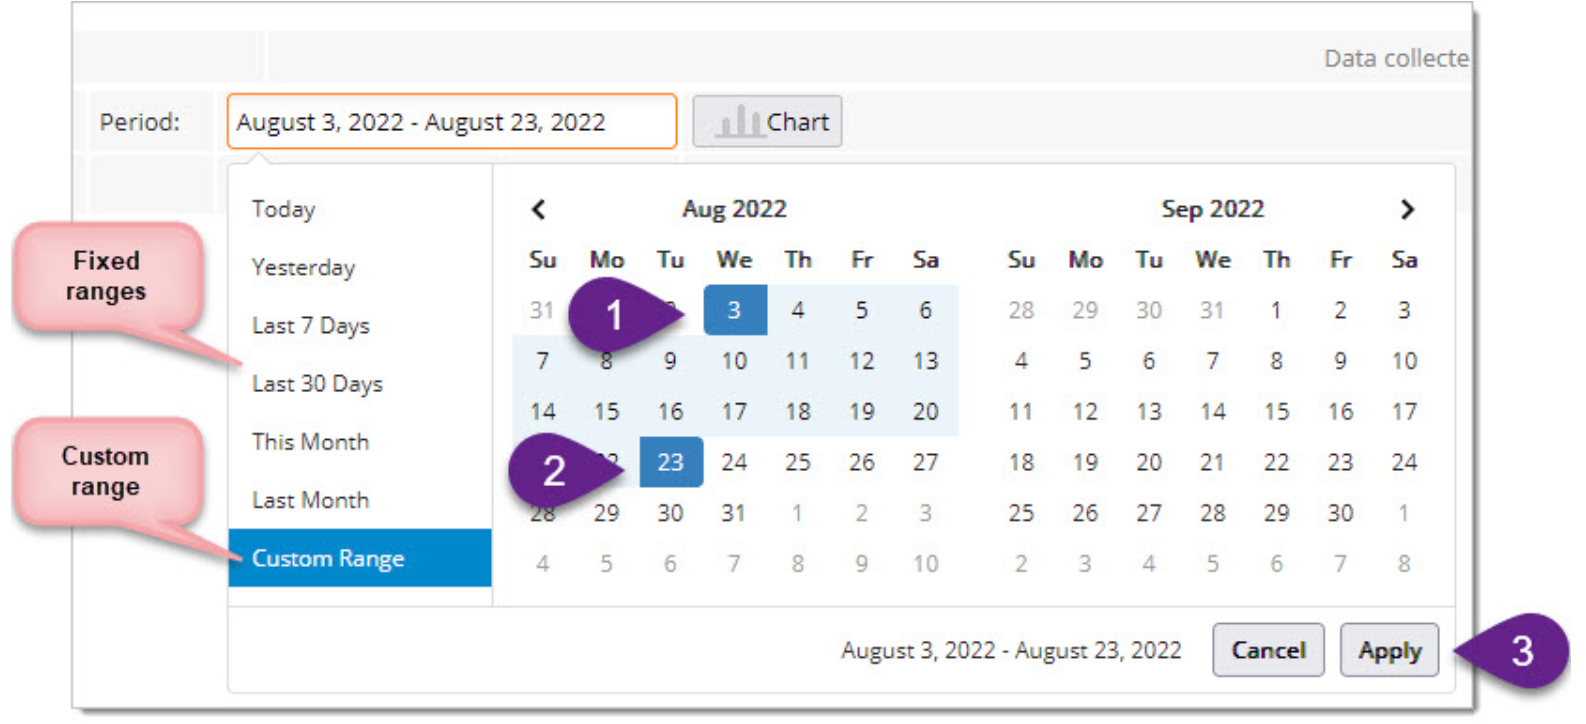
Selecting a date range
Choose from predefined date ranges or create a custom range.
To set a custom range: click the first day → the last day → then select Apply
Identifying problem rooms
Embedded Analytics helps you go beyond the numbers to uncover why certain spaces perform poorly.
Imagine your organisation has five meeting rooms, and reports show that Room 3 is barely used. At first glance, it might seem like you could simply remove or repurpose it to save costs. However, if the remaining rooms are frequently fully booked, the data suggests there is demand - meaning the issue likely lies with Room 3 itself.
Embedded Analytics allows you to pinpoint the cause. For example, it could be an issue with:
-
Room environment: too hot, cold, stuffy, dark, noisy, or uncomfortable
-
Location: inconveniently placed, hard to find, or in an area people avoid
-
Size or layout: too small, too large, or awkwardly shaped
-
Facilities: missing or unreliable equipment
-
User perception: people may avoid the room out of habit or may not realise it offers certain features
By surveying users and correlating feedback with the analytics data, you can quickly identify what’s wrong and take action to increase utilisation.
Understanding meeting issues
Embedded Analytics doesn’t just measure room performance - it highlights meeting behaviour too.
Are meetings consistently overrunning or being cancelled? Do some attract very few attendees? Are many so short they might not have been necessary?
With this visibility, you can recognise patterns, make informed improvements to meeting culture, and ensure that spaces are being used effectively.
By combining these insights with best practices for workplace collaboration, Door Tablet helps you create an environment where every meeting - and every room - serves a clear purpose.
Ready to get started?
Register here or get in touch